By mapping on a regular basis the time-variable gravity field of the Earth, GRACE and now GRACE Follow-On permit to monitor variations of Terrestrial Water Storage (TWS) at a regional scale. In the case of large drainage basins, previous studies have shown that the time evolution of TWS and discharge at the basin’s outlet can clearly reveal the underlying global drainage dynamics. We further develop this observation for specific catchments, where linear models in the form of differential equations can reasonably well approximate the TWS-discharge relationship. The identification of such continuous-time models from discrete data, although challenging, allows part of the model parameters to be interpreted physically (e.g. time constant, damping ratio) and therefore gives new insight into the dynamics. One important parameter of the TWS-discharge model is the temporal mean of the total drainable water storage, which represents the total volume of water dynamically connected to the drainage system in the catchment. For instance, we estimate it to be 1925 km3 for the catchment upstream Óbidos, covering almost 80 % of the whole Amazon basin.
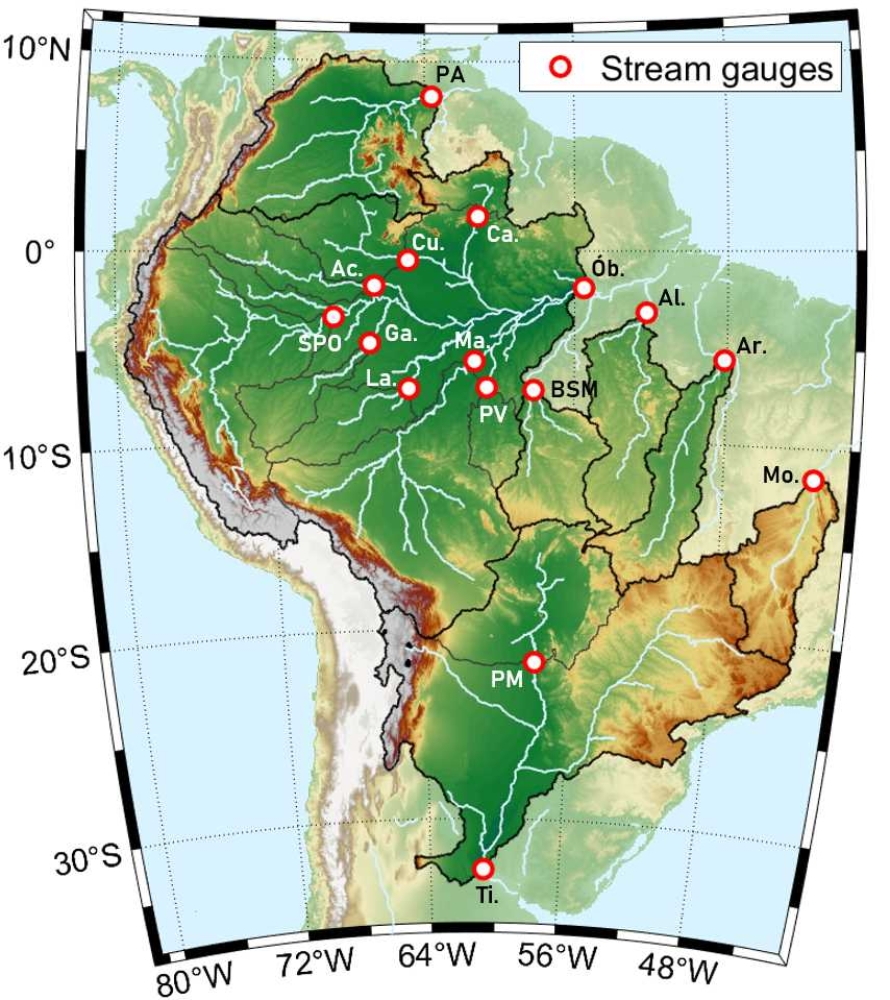
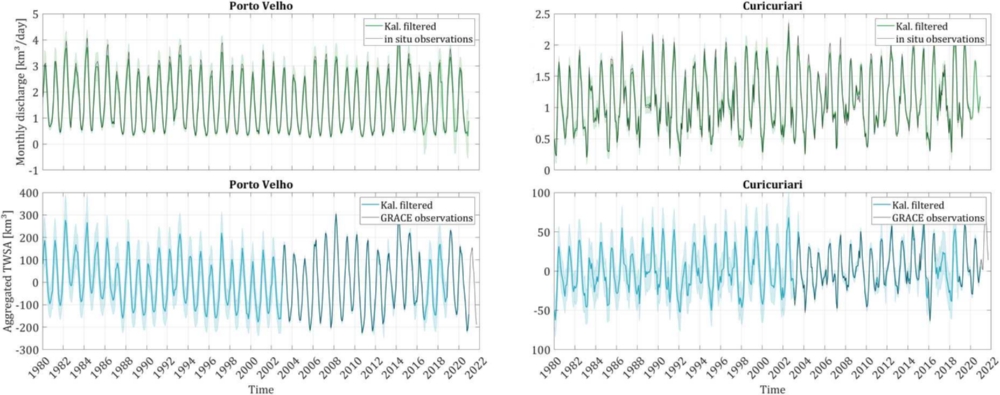
Once the linear TWS-discharge model is identified and reformulated in a state-space representation, we couple it with the water mass balance equation to form a mass-conserving rainfall-storage-discharge model of the catchment. A major advantage of this approach is that the resulting model is calibrated independently of the system input data, namely the precipitation and evapotranspiration. In the classical calibration process, the estimated model parameters would strongly dependent on the choice of an estimate of these fluxes, which usually suffer from large discrepancies from one data set to another. Conversely, the rainfall storage-discharge model can be used to evaluate the accuracy of different input data set by comparing their ability to simulate correctly the observed output. The identification of linear rainfall-storage-discharge models, when possible, has been carried out on 16 south-American catchments (see their distribution on Figure 1) with the aim of reconstructing continuous time series of monthly TWS and discharge from 1980 to 2022 via a Kalman smoother. The results are shown for 2 Amazonian sub-catchments in Figure 2. In most cases, we find that ERA-5 precipitation reanalysis yields the best simulation results.