Continental water storage is an essential part of the global hydrological cycle. Among the Earth’s water storage components, terrestrial surface water in lakes and reservoirs is essential for wildlife and human habitats as they store freshwater in the most accessible way, control seasonal floods and generate hydropower. Despite the negligible spatial coverage, lakes and reservoirs act as a buffer against climate extremes and have a crucial role in the climate system by affecting the land-atmosphere interaction processes like the global carbon and methane cycles. Despite the importance, the estimation of surface water storage variation at a global scale is usually obtained from simplified models due to the absence and lack of necessary measurements. In recent decades, the breakthrough in spaceborne geodetic techniques has enabled us to overcome the lack of comprehensive measurements of surface water variables. Satellite altimetry and imaging missions provide consistent measurements for generating dense and long time series of water level and surface water area of lakes and reservoirs. The water area-level relationship can be obtained by pairing the simultaneous water area and height measurements. Afterward, the time series water volume change is calculated, benefiting from the developed model and the measurements. However, satellite altimetry missions cannot measure the water level of the majority of inland lakes and reservoirs because of the large ground track separation. To overcome this issue, the water area-height relationship and water storage variation can be obtained, benefiting from water area estimates from satellite imagery and water height information extracted from Digital Elevation Models (DEM).
We developed water volume variation time series for 182 255 lakes and reservoirs larger than 1km2 from 1984 to 2018. To do so, water area time series of lakes and reservoirs are obtained from the Global Surface Water Data set provided by the Joint Research Centre of the European Commission. For more than 1000 lakes and reservoirs with available in situ or altimetric water level measurements, water volume anomaly time series are generated using the direct measurements. For the remaining water bodies, water volume anomaly time series are obtained by incorporating water area time series and the height information obtained from TanDEM-X DEM.
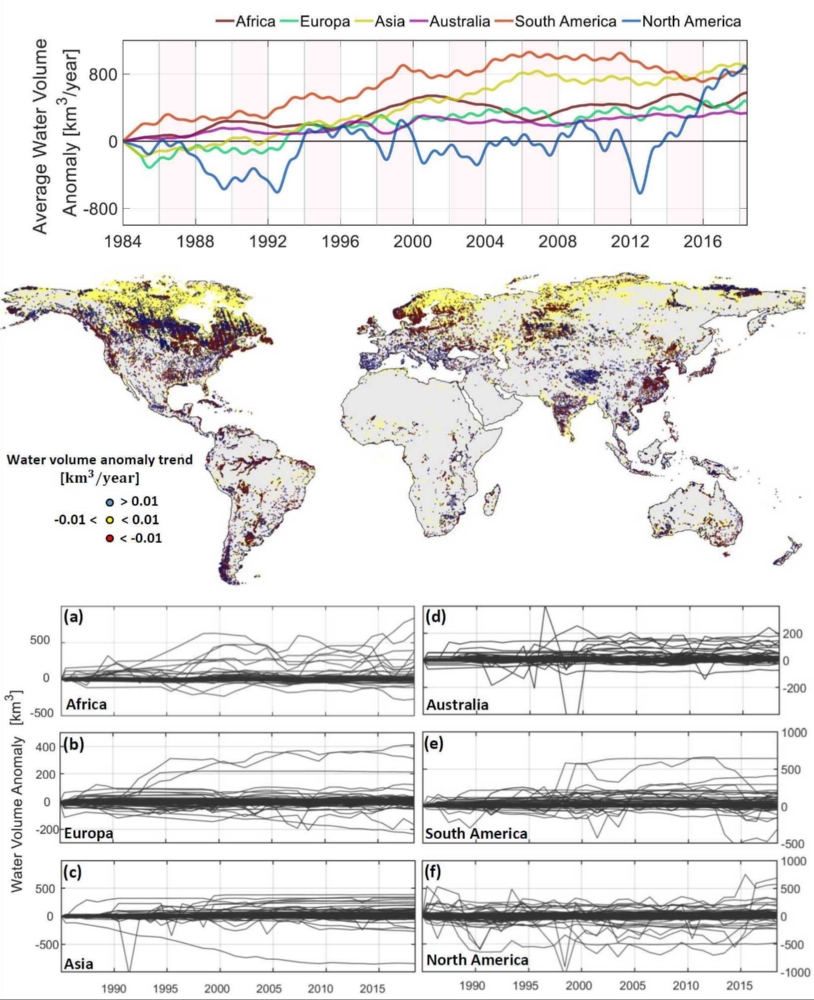
The annual water volume anomaly time series of 182 255 global lakes and reservoirs are plotted in Figure 1(a–f). Most of the water bodies do not show any significant variation during the 35 years monitoring. However, in each continent, there are a couple of water bodies with significant positive and negative trends and annual variations during the monitoring period. Figure 1 (top panel) presents the time series of total surface water volume anomaly for each continent. Interestingly, the total surface water volume anomaly has almost the same pattern in Africa, Asia, South America and Australia. All of them have a positive trend from 1984 until 2008. After 2008, the rate of the positive trend slightly decreases in Asia, Africa and Australia. Surface water storage shows a negative trend from 2008 until 2018 in South America. The total surface water anomaly doesn’t show any significant trend in Europa. After a considerable drop in the early years (1984–1988), surface water storage gradually increased and recovered the water storage lost in the early monitoring phase until 2013. Because of so many large lakes and reservoirs in North America, the magnitude of the surface water storage change is larger than in other continents. Despite the remarkable variation in the water volume change, the time series of North America does not show any clear pattern until 2014. After that, the annual surface water volume increased significantly until the end of the monitoring period, and the surface water storage increased about 5000 km3 in 2018 in comparison to 1984.