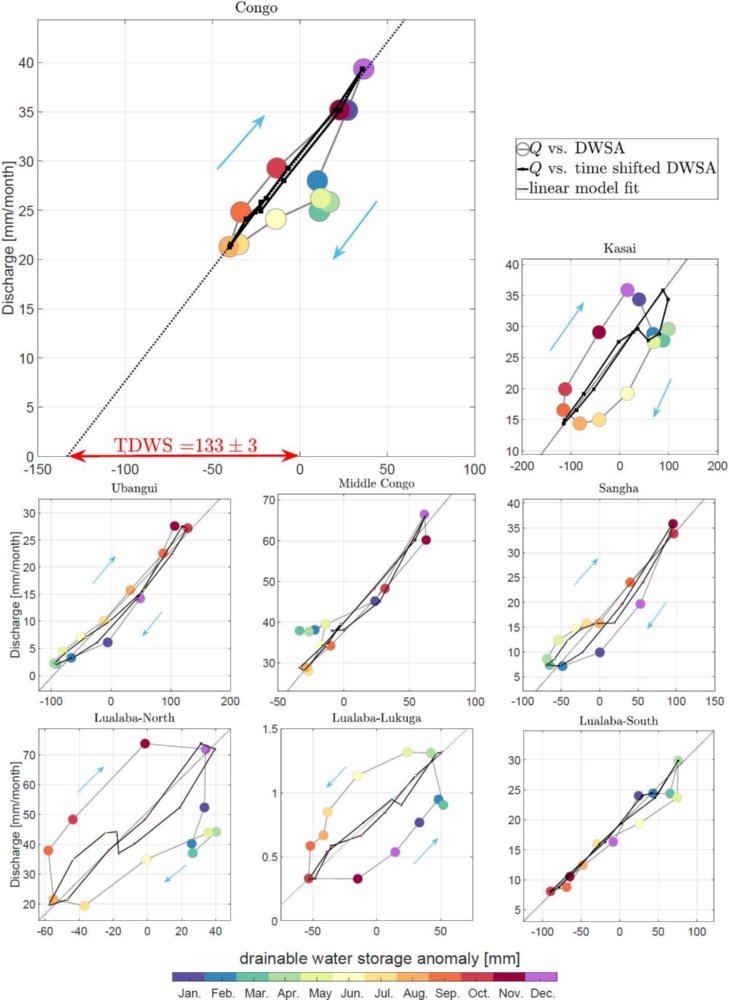
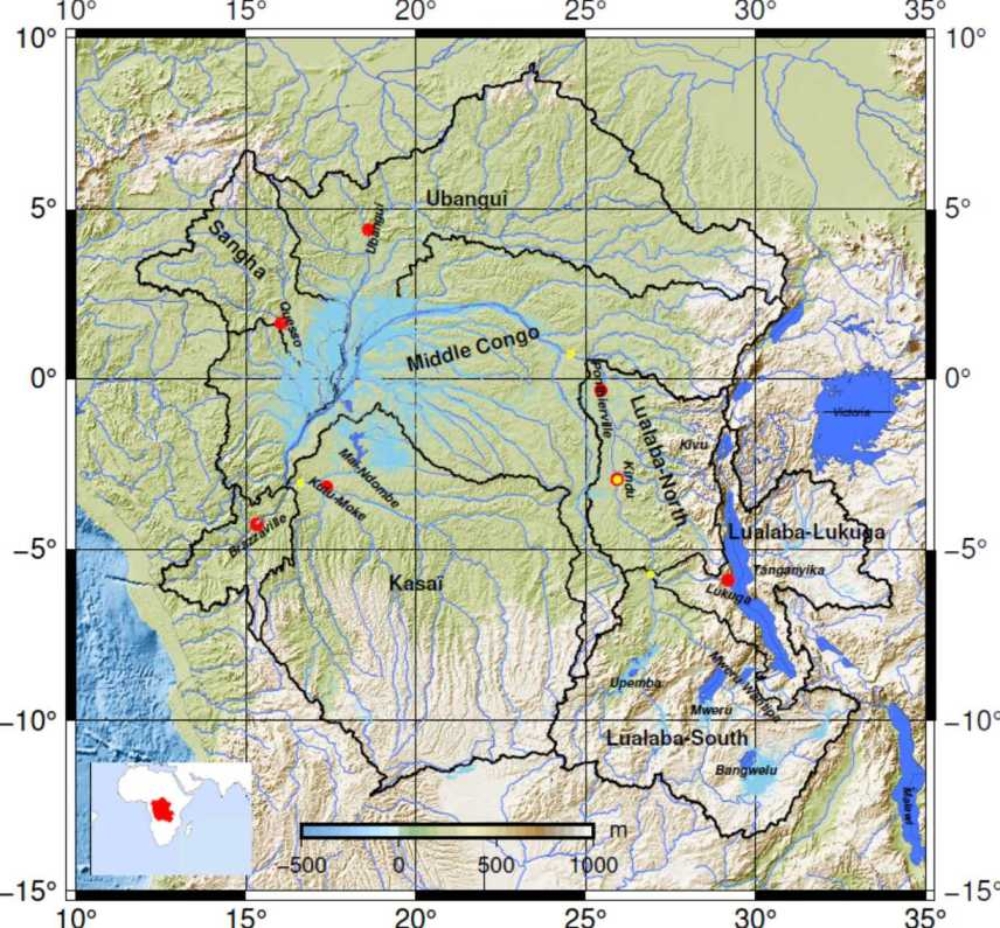
The Congo Basin (Figure 1) is of global significance for biodiversity and the water and carbon cycles. However, its freshwater availability remains highly unknown. Here, we leverage two decades of satellite and in situ observations to develop a new method that characterizes the relationship between Drainable Water Storage Anomaly (DWSA) and river discharge across the entire basin. We obtain DWSA by subtracting spaceborne estimates of the Lake Water Storage Anomaly (LWSA) and the Wetland Water Storage Anomaly (WWSA) from the TotalWater Storage Anomaly (TWSA) of GRACE. We determine theTDWS of the Congo Basin to be only 476±10 km3 (Figure 2).
This water amount corresponds to 133±3 mm of equivalent drainable water height, i.e., the level at which the discharge in Figure 2 reaches zero. Our results show that currently the Congo Basin’s Total Drainable Water Storage lies within a range of 476 km3 to 502 km3, unevenly distributed throughout the region, with 63 % being stored in the southernmost subbasins, Kasaï (220–228 km3) and Lualaba (109–169 km3), while the northern sub-basins contribute only 173±8 km3. We further estimate the hydraulic time constant for draining its entire water storage to be 4.3±0.1 months, but, regionally, permanent wetlands and large lakes act as resistors resulting in greater time constants of up to 105±3 months. Our estimate provides a robust basis to address the challenges of water demand for 120 million inhabitants, a population expected to double in a few decades.